
Using WP_DEBUG Safely on a Live Site
The safe WP_DEBUG setup for live sites, with test results showing what visitors see under each setting, how to read the log and how to handle fatal errors.
 Keyur
10 min read
On this page
To use WP_DEBUG safely on a live site, turn it on with error display switched off and logging switched on. Write the log to a file outside the public web folder, reproduce the problem, read the log, then turn debugging off again. The safe combination is WP_DEBUG true, WP_DEBUG_DISPLAY false and WP_DEBUG_LOG set to a private file path. Never switch on WP_DEBUG by itself. WordPress shows errors on screen by default when debugging is on. Visitors see them, they reveal file paths, and they can break JSON responses that forms and the block editor rely on.
This post explains what each debugging constant does and gives a step-by-step routine for a live site. It also covers how to read the log and what to do about fatal errors. Every scenario in it was tested on a WordPress 7.1.3 test site, using a small plugin that deliberately triggered a warning and a fatal error. The results show exactly what visitors would see with each setting.
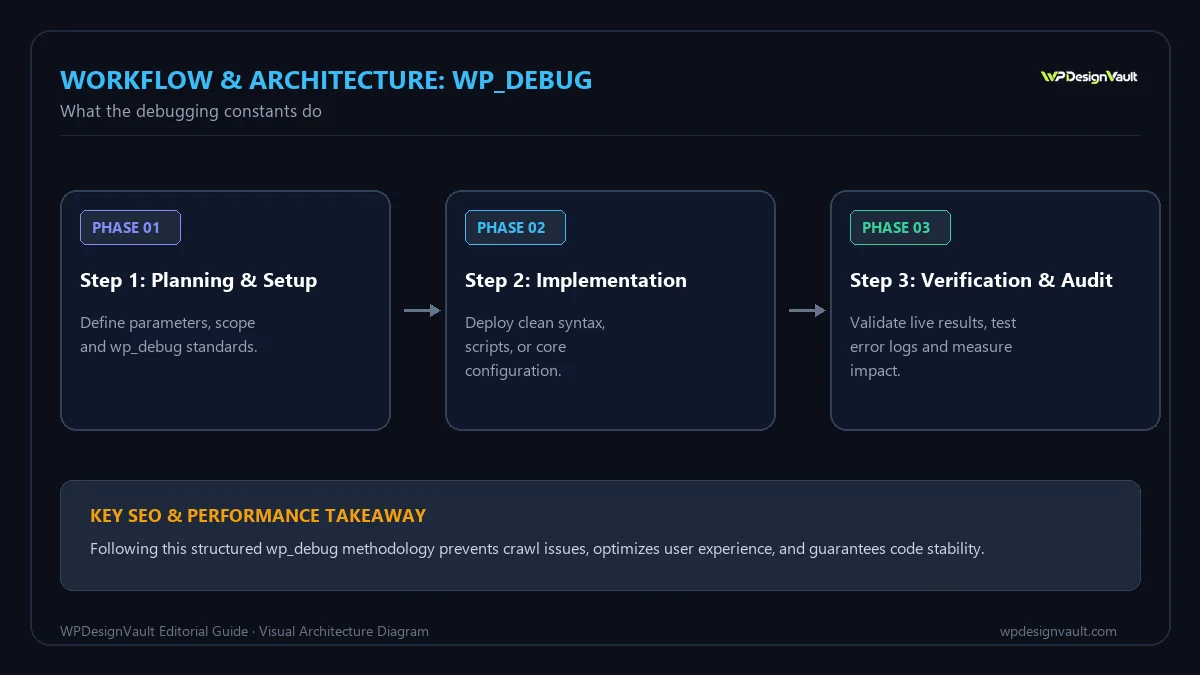
What the debugging constants do
Table: WordPress debugging constants (defaults from WordPress core)
| Constant | Default | Effect when set |
|---|---|---|
WP_DEBUG |
false |
true makes PHP report all errors, warnings and notices |
WP_DEBUG_DISPLAY |
true |
Controls whether errors are printed on the page while WP_DEBUG is on |
WP_DEBUG_LOG |
false |
true writes to wp-content/debug.log; a file path writes to that file instead |
SCRIPT_DEBUG |
false |
Loads unminified core CSS and JavaScript, for front-end debugging |
WP_DISABLE_FATAL_ERROR_HANDLER |
Not set | true turns off WordPress's "critical error" handler and recovery mode |
The trap is in the second row. Because WP_DEBUG_DISPLAY defaults to true, adding only define( 'WP_DEBUG', true ); prints every warning into your pages.
What we saw on the test site
We added a small must-use plugin that triggered a PHP warning (reading a missing array key) on a front-end page and in a REST API request, and a fatal error (calling an undefined function) on request. Then we tried each configuration. The server's own PHP setting had display_errors off, as most production hosts do.
Table: Results by configuration (WordPress 7.1.3 test site)
| Configuration | Warning shown to visitors? | REST API response | Logged? |
|---|---|---|---|
A: WP_DEBUG false (default) |
No | Valid JSON | No |
B: WP_DEBUG true only |
Yes, with the full server file path | Broken: warning HTML printed before the JSON | No |
C: plus WP_DEBUG_LOG true and WP_DEBUG_DISPLAY false |
No | Valid JSON | Yes, in wp-content/debug.log |
D: as C, but WP_DEBUG_LOG set to a private path |
No | Valid JSON | Yes, in the private file |
Configuration B is what many quick tutorials suggest. On our test site, it printed a warning naming the plugin file's full path on the server, and it put that warning in front of the REST API's JSON output, which made the response unreadable as JSON. Requests sent with an Accept: application/json header stayed valid, because WordPress turns display off for requests it recognises as JSON. Many requests from themes and plugins do not send that header. The block editor, forms and AJAX features can fail in confusing ways while display is on.
For fatal errors, WordPress's error handler showed the generic message "There has been a critical error on this website" with status 500 in both B and C. In B, the PHP fatal error details were printed on the page as well. In C and D, visitors saw only the generic message, and the details went to the log.
Before you start
- Back up
wp-config.phpso you can restore it if you make a typing mistake. - Use staging if you can. Reproduce the problem on a copy of the site first. Debug live only when the problem appears only there.
- Find a private folder for the log, outside the public web root, such as a
logsfolder in your hosting account's home directory. Your host's file manager shows the full path. - Know how to reproduce the problem: the page, the button or the time it happens.
- Plan to turn debugging off as soon as you have what you need.

Step by step: debug a live site safely
- Open
wp-config.phpand find the linedefine( 'WP_DEBUG', false );. - Replace it with this block (above the "stop editing" line), using your own private path:
define( 'WP_DEBUG', true );
define( 'WP_DEBUG_LOG', '/home/account/logs/wp-debug.log' );
define( 'WP_DEBUG_DISPLAY', false );
Then work through the rest of the routine:
- Check: save the file, load a page and confirm no errors appear on screen.
- Reproduce: repeat the action that causes the problem.
- Read: download the log file and find the entries with matching times.
- Switch off: when you have what you need, set
WP_DEBUGback to false and delete the log, or move it to a private archive.
Edit the existing WP_DEBUG line rather than adding a second one. If a constant is defined twice, PHP keeps the first value and ignores yours. Our guide to wp-config.php settings covers where custom lines go and other editing mistakes.
If you have to use the default log location
Some hosts do not let PHP write outside the web root. If you set WP_DEBUG_LOG to true, the log goes to wp-content/debug.log, inside the public web folder. On a plain Apache server we tested for our wp-config guide, that file downloaded with status 200 until it was blocked. Block it before you start:
# Apache: wp-content/.htaccess
<Files "debug.log">
  Require all denied
</Files>
# Nginx: inside the server block
location = /wp-content/debug.log { deny all; }Then confirm with the HTTP status checker that /wp-content/debug.log returns 403 or 404, not 200. Our guide to the default WordPress .htaccess file explains where Apache rules go.
Reading the log
Each line has a timestamp, a severity and a message with a file and line number. An illustrative entry:
[14-Oct-2026 12:41:07 UTC] PHP Warning: Undefined array key "missing_key" in /home/account/public_html/wp-content/plugins/example-plugin/includes/cart.php on line 88Table: Severity levels you will see
| Level | Meaning | Urgency |
|---|---|---|
| Fatal error | PHP stopped; the page failed | Fix now |
| Warning | Something went wrong but the page continued | Investigate |
| Notice | A minor problem, often harmless | Low, unless repeated constantly |
| Deprecated | Code uses a feature that will be removed in a future PHP or WordPress version | Plan an update |
The file path tells you where the problem is. A path containing /plugins/example-plugin/ points to that plugin, /themes/ to a theme, and /wp-includes/ or /wp-admin/ usually to a plugin or theme calling core incorrectly rather than a core bug.
Worked example: tracking down a broken checkout button
An illustrative shop reports that "Place order" sometimes spins and never finishes.
- The developer enables configuration D with a private log path.
- They place a test order and watch the browser's Network panel. The checkout request returns a response that starts with HTML instead of JSON.
- The log shows a warning from a shipping plugin's file on each checkout, at the same second as the failed request.
- On staging, they update the shipping plugin, and the warning disappears.
- They apply the update on live, confirm a test order works, then set
WP_DEBUGback to false and delete the log.
In this case, someone had earlier left WP_DEBUG on with display enabled. The printed warning was corrupting the JSON response, which is exactly the failure our test reproduced with the REST API.
Fatal errors and recovery mode
Since WordPress 5.2, a fatal error caused by a plugin or theme shows visitors a generic "critical error" message rather than a white screen. WordPress also tries to email the site administrator a link to recovery mode, which lets an administrator log in with the faulty plugin or theme paused. If you do not get the email, check the admin email address in Settings → General and your site's mail delivery.
Leave the fatal error handler on for live sites. WP_DISABLE_FATAL_ERROR_HANDLER is meant for development environments where you want raw errors.
Keeping debugging tidy
- Set an end time. Debug for the shortest time that captures the problem.
- Watch log size. A busy site with a noisy plugin can write a very large log quickly.
- Do not share raw logs publicly. They can contain file paths, plugin names, usernames and request data. Trim them before posting in support forums.
- Mark environments. Set
WP_ENVIRONMENT_TYPEtostagingon staging so plugins can behave accordingly, and keep debug display on there only.
Verify debugging is safely off afterwards
- Open
wp-config.phpand confirmWP_DEBUGis false, or the debug block is removed. - Check Tools → Site Health → Info → WordPress Constants, which lists the values WordPress is using.
- Request the old log location in a browser and confirm it is not downloadable.
- Delete or archive the log file.
If you are setting up a site from scratch, the wp-config.php generator lets you choose debug logging and keeps on-screen errors as a separate, development-only option.
Common mistakes
- Adding only
define( 'WP_DEBUG', true );on a live site. - Leaving debugging on for weeks and filling the disk with logs.
- Logging to
wp-content/debug.logwithout blocking public access. - Adding a second
WP_DEBUGline below the original one, which PHP ignores. - Putting the debug block after the
require_once ABSPATH . 'wp-settings.php';line, where it is too late. - Pasting raw logs into public support threads.
- Disabling the fatal error handler on production.
Troubleshooting
Table: WP_DEBUG problems and fixes
| Symptom | Likely cause | Fix |
|---|---|---|
| Errors visible on the site | WP_DEBUG_DISPLAY not set to false |
Add define( 'WP_DEBUG_DISPLAY', false ); |
| No log file appears | WP_DEBUG is false, the folder is not writable, a duplicate constant, or no errors yet |
Check each; reproduce the problem |
| Block editor or forms fail after enabling debug | Warnings printed into JSON responses | Turn display off |
| Log grows very quickly | A notice or deprecation repeated on every request | Fix or update the source; turn debugging off after capture |
| "There has been a critical error" message | A fatal error | Read the log; use the recovery mode email to log in |
| Changes to wp-config.php seem ignored for a moment | PHP OPcache serving the old file | Wait a few seconds, or clear OPcache in your host's panel |
Frequently asked questions
Is it safe to turn on WP_DEBUG on a live site?
Only with display off and logging on. WP_DEBUG alone prints errors to visitors, and in our test it exposed a file path and broke REST API responses.
Where is the WordPress debug log?
In wp-content/debug.log if WP_DEBUG_LOG is true, or at the path you give it if you set WP_DEBUG_LOG to a file path.
Why is WP_DEBUG_DISPLAY important?
It defaults to true, so with WP_DEBUG on, errors appear in pages unless you set it to false.
Can I change where the debug log is saved?
Yes. Set WP_DEBUG_LOG to a full file path, ideally outside the public web folder. WordPress core supports a path as well as true or false.
Why is my debug.log empty or missing?
Debugging may be off, the constant may be defined twice, the folder may not be writable, or no errors have happened since you turned it on.
Does WP_DEBUG slow down a site?
Logging adds a little work, and very noisy logs can add more. That is one reason to turn debugging off when you have finished.
What is SCRIPT_DEBUG?
It makes WordPress load unminified core CSS and JavaScript, which helps debug front-end problems. Turn it off afterwards so visitors get the smaller files.
What is WordPress recovery mode?
When a plugin or theme causes a fatal error, WordPress emails the administrator a link that pauses the faulty extension so you can log in and fix it.
Should I disable the fatal error handler?
Not on a live site. It hides technical details from visitors and enables recovery mode. Disable it only in development.
Can I share my debug log in a support forum?
Share only the relevant lines, and remove file paths, usernames and request data first. Full logs can expose information about your server.
Next step
Add the three-line safe debugging block to wp-config.php with a private log path, reproduce your problem, and set WP_DEBUG back to false as soon as you have the log lines you need. For related configuration and server topics, browse our WordPress guides.
Related free tools for this topic
wp-config.php Generator
Generate a complete wp-config.php with database details, newly generated security keys, debug settings and useful constants. Keys are…
WordPress Snippet Generator
Generate clean, escaped WordPress code for the tasks developers repeat most: enqueueing scripts and styles, shortcodes, widget areas,…
WordPress Salt & Security Key Generator
Generate a fresh set of WordPress security keys and salts in your browser, ready to paste into wp-config.php.
Custom Taxonomy Generator
Generate clean, translation-ready register_taxonomy() code for WordPress, with category-style or tag-style behaviour, block editor support and admin columns.
HTTP Security Headers Generator
Generate recommended HTTP security headers for your site and get them as Apache, Nginx or WordPress PHP code.
301 Redirect Generator
Paste old and new URLs to generate exact-match redirect rules for Apache (.htaccess), Nginx or a WordPress snippet.…
Related resources

SaaS hero with dashboard preview
Two-column hero: headline, supporting text, two buttons and a trust line beside a visual panel. Stacks to one…
Centred SaaS hero with product window
Centred hero with a large headline, supporting text and two buttons, with optional highlights and a product window…

Dark studio hero with service highlights
Centred hero with a large headline, supporting text and two buttons, with optional highlights and a product window…
Related articles
How to Change WordPress Security Keys and Salts
What WordPress keys and salts do, when to change them, three ways to do it, and what we saw on a test…
How to Add a Favicon (Site Icon) in WordPress
Set a favicon with WordPress's Site Icon, see exactly which sizes and tags it generates (tested on WordPress 7.1.3), and fix icons…
Elementor Free vs Pro: What You Can Build with the Free Version
What Elementor's free version includes, what Pro adds on each plan, a worked example of a brochure site built for free, and…
Related guides

How Long Should a Meta Title Be? Pixels vs Characters Explained
"Keep it under 60 characters" is only half right. Google cuts titles by pixel width, not character count. Learn how to write…
The Default WordPress .htaccess File (and Safe Additions)
The exact .htaccess rules WordPress needs for pretty permalinks, what each line does, tested additions for HTTPS and file protection, and a…
Fluid Typography in Elementor with clamp()
Setting a heading to 56 px on desktop, 44 px on tablet and 32 px on mobile works, but text jumps between…
Comments